How to create charts and graphs with Excel in Microsoft Office 365

As part of our series of helping customers with their small business needs Longmont Computer Physicians, LLC is offering these free classes on how to use different software programs. Here is our instructional video on using Microsoft Excel spreadsheets. 

Microsoft 365 Beginner class – Excel
Microsoft 365 Intermediate class – Excel
Microsoft 365 Advanced class – Excel

Excel lets you easily create charts from the data in a worksheet. Charts are useful for times when you want to create visual representations of the worksheet data for meetings, presentations, or reports. To insert a chart, select the cell range that contains the data for the chart. Be sure to also select the data’s adjacent row and column labels to automatically apply them to the chart, saving you the step of selecting them later. You can adjust your data selection later, if needed, but selecting the data first lets you see chart previews more clearly. Next, click the “Insert” tab in the Ribbon. In the “Charts” button group are the types of charts you can insert. Starting in Excel 2019, two new chart types appear in this button group. You can access the new “Funnel” and “Map” chart types by clicking them within their respective chart type drop-down buttons in the “Charts” button group on the “Insert” tab of the Ribbon. Alternatively, you can select them after clicking the “Recommended Charts” button in the “Charts” button group on the “Insert” tab of the Ribbon.

One way to insert a chart is to click the “Recommended Charts” button in the “Charts” button group on the “Insert” tab of the Ribbon to open the “Insert Chart” dialog box and display the “Recommended Charts” tab. This tab shows the types of charts Excel thinks would best illustrate your selected data. You can click the choices at the left side of the tab to see a preview of the chart appear to the right. To insert one of the chart choices into the worksheet, click it to select it in the listing at the left side of the tab. Then click the “OK” button at the bottom of the “Insert Chart” dialog box. Another way to insert a chart based on your currently-selected data is to click the button that represents the general chart type to insert within the “Charts” button group on the “Insert” tab of the Ribbon. Then click the specific chart subtype to insert in the button’s drop-down menu. To view all the chart type choices and then insert a selected chart type, click the “See All Charts” button in the lower-right corner of the “Charts” button group to open the “Insert Chart” dialog box. To show all the available chart choices, click the “All Charts” tab. On this tab, you can select a major chart type from the listing at the left side of the dialog box. You can then select the specific subtype to insert by clicking the desired subtype in the list at the right side of the dialog box. To then insert the chart of the selected subtype, click the “OK” button at the bottom of the dialog box. Using any of these chart insertion methods inserts a chart of the selected subtype as an embedded chart object in the current worksheet. The next thing to note is that when a chart object is selected, a new contextual tab then appears in the Ribbon.

This is the “Chart Tools” contextual tab and it consists of two tabs, “Design” and “Format.” You use the buttons in the various button groups on these two tabs within the “Chart Tools” contextual tab to change the selected chart objects. When a chart is selected in Excel, a two-button or three-button grouping of chart options appears at the right side of the selected chart, depending on the chart type you inserted. The buttons are, from top to bottom, “Chart Elements,” “Chart Styles,” and, optionally, “Chart Filters.” You can also use these buttons to change your selected chart. When you insert a new chart into a worksheet, the entire chart is initially selected. The “Chart Tools” contextual tabs then appear in the Ribbon. Two or three drop-down buttons then also appear at the right side of the chart. When editing charts, the first task with which to familiarize yourself is selecting chart elements. Note that a chart is not a single object, but rather, is a complex object comprised of many smaller, selectable objects. You must know exactly which chart element is selected before starting any procedure, like formatting or editing the chart. One way to select chart objects is by using your mouse. You can click the individual chart elements to select them. To select the entire chart, click into the “Chart Area.” The Chart Area is the blank area surrounding most of the actual chart elements. For Microsoft Excel spreadsheets. Using Excel.

How to Create and Use Tables with Excel in Microsoft 365 and Office 365

As part of our series of helping customers with their small business needs Longmont Computer Physicians, LLC is offering these free classes on how to use different software programs. Here is our instructional video on using Microsoft Excel spreadsheets. 

Microsoft 365 Beginner class – Excel
Microsoft 365 Intermediate class – Excel
Microsoft 365 Advanced class – Excel

Excel can store information in tables. An Excel table is information saved in a table format and explicitly defined as a table in Excel. When you store information in a table format, you place the different types of information to collect in columns, called “fields” in database terminology. Each “field” contains a separate type of information. Examples could be: “First Name,” “Last Name,” “Title,” “Address,” “City,” “State,” and so on. Each row in the table is called a “record.” A record is a single entry in which you record each type of field information about a single instance of the subject of your table. For example, within a “Customers” table that contains the fields in the previous example, a record in that table might contain the information: “John,” “Doe,” “Mr.,” “111 Nowhere Ln.,” “Anytown,” “MI.” When entering data into a table, avoid creating entirely blank columns or rows! Having entirely blank columns and rows in a table can often lead to problems with sorting and filtering table data. Before you create a table in Excel, consider the information you must collect. Sometimes, it is easier to think of the fields to create after thinking of the subject of the table, first. For example, to create a table to record customer data, you must think about what information you want to collect about your customers.

The types of information you decide to track become the “fields,” or columns, in your table. For the purpose of the example, assume you decided to record your customer’s name, address, city, state, and zip code. When thinking of the table’s field structure, you need to consider how detailed to be with the customer’s information. Poor decisions in the planning phase can be problematic later. For example, do you want to record the customer’s name in one field or more than one field? If you ever want to sort the database by the last name of the customer, you will probably want to store the customer’s name in at least two fields: “firstname” and “lastname.” Noting little things like this during the creation process can save time in editing the table structure later on, after it becomes a problem. After deciding what information to record in which field, enter the titles of these fields as the top row of the table.

The top row in a table is a special row and is often called the “header row.” It is always the top row in a table and it displays the names of the fields for which you are collecting data. After creating the header row, you can then define it as a “table” in Excel to enable the table management features. To do this, select the cells within the header row. Then click the “Table” button in the “Tables” button group on the “Insert” tab of the Ribbon. In the “Create Table” dialog box that appears, the reference to the selected cells appears in the “Where is the data for your table:” field. Check the “My table has headers” checkbox and then click the “OK” button. Doing this then creates the table area within the worksheet and adds a new row into which you can enter your first table record.

Another way to create a table in Excel is to create the header row of your table and then enter as many records as you want to initially record. Then click and drag over the entire table, including the header row and all the table’s records, to select it. After selecting it, click the “Format as Table” button in the “Styles” button group on the “Home” tab of the Ribbon. Then select the table style to apply from the dropdown menu that appears. At this point, the “Format As Table” dialog box then appears. The range of selected cells also appears in the “Where is the data for your table?” field. If your table has a header row at the top of the table, be sure to check the “My table has headers” checkbox. Then click the “OK” button to apply the selected style, and also define the range of cells as a table. Note that each field within the header row of a table has a drop-down button in it. These are “AutoFilters,” which you use to filter data in the table. We will look at using those in a later lesson. Also notice that the table has a different formatting than the rest of the worksheet area in Excel.

Boulder Computer Repair

Computer Physicians loves Boulder! We are glad to be your full time Computer company in Boulder, CO. We have been in business since 1999. Our office is close by Boulder servicing Boulder regularly. Call us for a appointment in Boulder Colorado. Providing Computer Repair, upgrades, sales, installations, troubleshooting, networking, internet help, Virus removal, and training.

New versions of Song Director released in 2018

There have been some new versions of Song Director released in 2018.

To know which version you are using go the pull down help menu and choose “about”

To get the latest version, simply download Song Director again from the website and install it into the same location as before, just like the first time.  The setup program will not overwrite any of your existing data.   Here are the changes:

(more…)

Microsoft SCAM Solved

I went to  fix a computer from a customer in Erie, Colorado who got scammed from someone that took over their computer on remote access saying they were from Microsoft.

Microsoft SCAM Erie, Colorado

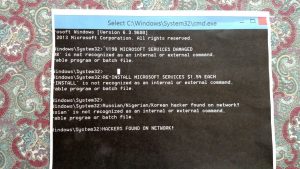
I traced the steps.Very interesting what they did they use the command prompt to put fake commands in saying that hackers were infiltrating your system and they needed to pay money to fix the issue. They said they were from Microsoft and need to fix the problems created by the hackers.

There are no hackers they put fake messages in certain places where you check the system for errors. Here’s a printout of the Windows command prompt with  bogus information

People who are not technicians are fooled by this. but this is a command prompt this is not a error screen. That’s why it says it’s an unrecognized command Copying and pasting bogus error information in the command prompt you supposed to only be typing commands People get confused by this who don’t know about computers.

Saying that you must  install Microsoft services at $1.54 a piece 198 times for each service. Then they take the credit card information charge your credit card for that and God knows for what else. They also did other things working very fast having the customer do things on the computer to distract your attention and having a lot of pop-up screens. While taking over the computer with remote access.

Microsoft SCAM Fixed Erie Colorado

I was able to undo any damage they caused and get the computer back up and running like before.  So in the end I fixed the issue.  But people need to call Computer Physicians if they get a problem with their computer so that they don’t cause more issues or problems.  This hacker could have done worse if the customer did not call Longmont Computer Physicians to come solve the issue.

Computer Networks in Longmont Denver Erie Colorado Computer Physicians

Networking is one of the jobs that Longmont Computer Physicians, LLC does to help it’s clients.  Sometimes it is wireless networks, other times the client wants a wired computer network.

I needed to hard wire an entire house with CAT5e cabling for a client a few months ago for internet and file sharing access.   It was a great success!  8 rooms in the house had access to a network cable for computers.

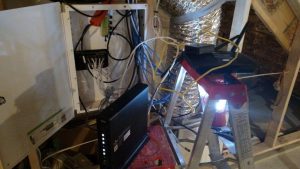
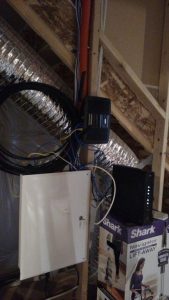
Here are some pictures of the job of the patch cables and routers running into the house and through the walls.

Computer networking in Denver Boulder Colorado router and CAT 5e cable PC repair

Computer Networking in Boulder Longmont Denver Erie Colorado PC Repair

PC Computer Networking in Longmont, Boulder, Denver, Erie Colorado

Computer Repair Windows update in Longmont, Boulder, CO

Our Longmont Computer Physicians, LLC office computer had an interesting issue recently I thought I would share:

After an automatic installing of windows 10 update for Valentine’s Day Feb 14, 2018 (KB4074588) my USB keyboard on my desktop computer would no longer work. I tried 3 different USB keyboards  – none worked.  So I went into device manager to uninstall, reinstall, and update the keyboard drivers.  That did not work. So then I uninstalled the windows update.  This fixed the problem, but the update would try to install again the next time I reboot.   So I set the windows update to never install hardware drivers during the update in (system properties) I would need to choose what driver update I want manually from now on.

Computer Physicians provides PC computer networking, repair, Data Recovery, training and virus removal  in Longmont, Boulder, Denver, Erie Colorado and the Colorado Front Range

Boulder/Longmont Computer Repair – PC with no hard drive used

Longmont Colorado PC Computer not using it’s hard drive:

Computer Physicians, LLC  just worked on a unusual situation on a Zotac mini PC computer in Longmont, CO that had a boot windows drive that was filled up.  I thought this would be good to share with my readers:

This very small Zotac mini PC computer running Windows 10 home with 4GB of RAM was booting to a 64GB memory chip located on the motherboard and was not using the 300GB internal SATA hard drive.  As a result since the Windows OS was on a small 64GB memory chip it quickly got filled to capacity.  I backed up the customer’s data to an external hard drive.   The internal hard drive was not being used except for the storing of a few small files.   I could not clone the 64GB memory chip but was able to transfer the OS using special disk software.  I then needed to go into the BIOS and set the boot drive to the internal drive.  The computer is running  slower now since it is not using the small 64GB memory chip for windows and the CPU and computer itself is an inexpensive under-powered computer which was designed to run on the 64GB memory chip. The problem with this design is that the 64GB memory chip quickly gets filled to capacity.  (Windows 10 uses a lot of hard drive memory most systems have 1000GB or more)

I do not like this design and would not recommend this Zotac computer to a client.

The computer will run faster if the original drive is replaced with a solid state drive and if the OS can be transferred and if more RAM memory is installed.

These are some of the situations that Computer Physicians, LLC runs into.

-Steve

Trends in PC technology – Computer Physicians Longmont/Boulder/Erie, CO

 https://www.computer-physicians.com/
Computer repair data recovery networking virus removal in Longmont/Boulder/Denver Colorado

 Here is a good article which talks about the changes in PC technology and the trends.

Past, Present and Future Trends in the Use
of Computers in Fisheries Research By
Bernard A. Megrey and Erlend Moksness
1.2 Hardware Advances
It is difficult not to marvel at how quickly computer technology advances. The
current typical desktop or laptop computer, compared to the original mono-
chrome 8 KB random access memory (RAM), 4 MHz 8088 microcomputer or
the original Apple II, has improved several orders of magnitude in many areas.
The most notable of these hardware advances are processing capability,
color graphics resolution and display technology, hard disk storage, and the
amount of RAM. The most remarkable thing is that since 1982, the cost of a
high-end microcomputer system has remained in the neighborhood of $US
3,000. This statement was true in 1982, at the printing of the last edition of
this book in 1996, and it holds true today.
1.2.1 CPUs and RAM
While we can recognize that computer technology changes quickly, this state-
ment does not seem to adequately describe what sometimes seems to be the
breakneck pace of improvements in the heart of any electronic computing
engine, the central processing unit (CPU). The transistor, invented at Bell
Labs in 1947, is the fundamental electronic component of the CPU chip. Higher
performance CPUs require more logic circuitry, and this is reflected in steadily
rising transistor densities. Simply put, the number of transistors in a CPU is a
rough measure of its computational power which is usually measured in floating
point mathematical operations per second (FLOPS). The more transistors there
are in the CPU, or silicon engine, the more work it can do.
Trends in transistor density over time, reveal that density typically doubles
approximately every year and a half according to a well know axiom known as
Moore’s Law. This proposition, suggested by Intel co-founder Gordon Moore
(Moore 1965), was part observation and part marketing prophesy. In 1965
Moore, then director of R&D at Fairchild Semiconductor, the first large-scale
producer of commercial integrated circuits, wrote an internal paper in which he
drew a line though five points representing the number of components per
integrated circuit for minimum cost for the components developed between
1959 and 1964
The prediction arising
from this observation became a self-fulfilling prophecy that emerged as one of
the driving principals of the semiconductor industry. As it related to computer
CPUs (one type of integrated circuit), Moore’s Law states that the number of
transistors packed into a CPU doubles every 18–24 months.
Figure 1.1 supports this claim. In 1979, the 8088 CPU had 29,000 transistors.
In 1997, the Pentium II had 7.5 million transistors, in 2000 the Pentium 4 had
420 million, and the trend continues so that in 2007, the Dual-Core Itanium 2
processor has 1.7 billion transistors. In addition to transistor density, data
1 Past, Present and Future Trends in the Use of Computers
) of CPU
performance. Note y-axis is on the log scale (Source: http://en.wikipedia.org/wiki/Teraflop,
accessed 12 January 2008)
1 Past, Present and Future Trends in the Use of Computers
5
Manufacturing technology appears to be reaching its limits in terms of how
dense silicon chips can be manufactured – in other words, how many transistors
can fit onto CPU chips and how fast their internal clocks can be run. As stated
recently in the BBC News, ‘‘The industry now believes that we are approaching
the limits of what classical technology – cla
ssical being as refined over the last 40
years – can do.’’ There is a problem with making microprocessor
circuitry smaller. Power leaks, the unwan
ted leakage of electricity or electrons
between circuits packed ever closer toget
her, take place. Overheating becomes a
problem as processor architecture gets ever smaller and clock speeds increase.
Traditional processors have one processing engine on a chip. One method
used to increase performance through higher transistor densities, without
increasing clock speed, is to put more than one CPU on a chip and to allow
them to independently operate on different tasks (called threads). These
advanced chips are called multiple-core processors. A dual-core processor
squeezes two CPU engines onto a single chip. Quad-core processors have four
engines. Multiple-core chips are all 64-bit meaning that they can work through
64 bits of data per instruction. That is twice rate of the current standard 32-bit
processor. A dual-core processor theoretically doubles your computing power
since a dual-core processor can handle two threads of data simultaneously. The
result is there is less waiting for tasks to complete. A quad-core chip can handle
four threads of data.
Progress marches on. Intel announced in February 2007 that it had a
prototype CPU that contains 80 processor cores and is capable of 1 teraflop
(10
12
floating point operations per second) of processing capacity. The potential
uses of a desktop fingernail-sized 80-core chip with supercomputer-like perfor-
mance will open unimaginable opportunities (Source: http://www.intel.com/
pressroom/archive/releases/20070204comp.htm, accessed 12 January 2008).
As if multiple core CPUs were not powerful enough, new products being
developed will feature ‘‘dynamically scalable’’ architecture, meaning that vir-
tually every part of the processor – including cores, cache, threads, interfaces,
and power – can be dynamically allocated based on performance, power and
thermal requirements.
Supercomputers may
soon be the same size as a laptop if IBM brings to the market silicon nanopho-
tonics. In this new technology, wires on a chip are replaced with pulses of light
on tiny optical fibers for quicker and more power-efficient data transfers
between processor cores on a chip. This new technology is about 100 times
faster, consumes one-tenth as much power, and generates less heat (
Multi-core processors pack a lot of power. There is just one problem: most
software programs are lagging behind hardware improvements. To get the most
out of a 64-bit processor, you need an operating system and application
programs that support it. Unfortunately, as of the time of this writing, most
software applications and operating systems are not written to take advantage
of the power made available with multiple cores. Slowly this will change.
Currently there are 64-bit versions of Linux, Solaris, and Windows XP, and
Vista. However, 64-bit versions of most device drivers are not available, so for
today’s uses, a 64-bit operating system can become frustrating due to a lack of
available drivers.
Another current developing trend is building high performance computing
environments using computer clusters, which are groups of loosely coupled
computers, typically connected together through fast local area networks.
A cluster works together so that multiple processors can be used as though
they are a single computer. Clusters are usually deployed to improve perfor-
mance over that provided by a single computer, while typically being much less
expensive than single computers of comparable speed or availability.
Beowulf is a design for high-performance parallel computing clusters using
inexpensive personal computer hardware. It was originally developed by
NASA’s Thomas Sterling and Donald Becker. The name comes from the
main character in the Old English epic poem Beowulf.
A Beowulf cluster of workstations is a group of usually identical PC com-
puters, configured into a multi-computer architecture, running a Open Source
Unix-like operating system, such as BSD or
Solaris They are joined into a small network and have libraries and
programs installed that allow processing to be shared among them. The server
node controls the whole cluster and serves files to the client nodes. It is also the
cluster’s console and gateway to the outside world. Large Beowulf machines
might have more than one server node, and possibly other nodes dedicated to
particular tasks, for example consoles or monitoring stations. Nodes are con-
figured and controlled by the server node, and do only what they are told to do
in a disk-less client configuration.
There is no particular piece of software that defines a cluster as a Beowulf.
Commonly used parallel processing libraries include Message Passing Interface;
(Both of these permit the programmer to divide a task among a group of
networked computers, and recollect the results of processing. Software must
be revised to take advantage of the cluster. Specifically, it must be capable of
performing multiple independent parallel operations that can be distributed
among the available processors. Microsoft also distributes a Windows Compute
Cluster Server 2003 (Source: http://www.microsoft.com/windowsserver2003/ccs/
default.aspx, accessed 12 January 2008) to facilitate building a high-performance
computing resource based on Microsoft’s Windows platforms.
One of the main differences between Beowulf and a cluster of workstations is
that Beowulf behaves more like a single machine rather than many worksta-
tions.
Past, Present and Future Trends in the Use of Computers
CPU + memory package which can be plugged into the
cluster, just like a CPU or memory module can be plugged into a motherboard.
(Source: http://en.wikipedia.org/wiki/Beowulf_(computing), accessed 12 January
2008). Beowulf systems are now deployed worldwide, chiefly in support of
scientific computing and their use in fisheries applications is increasing. Typical
configurations consist of multiple machines built on AMD’s Opteron 64-bit
and/or Athlon X2 64-bit processors.
Memory is the most readily accessible large-volume storage available to the
CPU. We expect that standard RAM configurations will continue to increase as
operating systems and application software become more full-featured and
demanding of RAM. For example, the ‘‘recommended’’ configuration for
Windows Vista Home Premium Edition and Apple’s new Leopard operating
systems is 2 GB of RAM, 1 GB to hold the operating system leaving 1 GB for
data and application code. In the previous edition, we predicted that in 3–5
years (1999–2001) 64–256 megabytes (MB) of Dynamic RAM will be available
and machines with 64 MB of RAM will be typical. This prediction was incred-
ibly inaccurate. Over the years, advances in semiconductor fabrication technol-
ogy have made gigabyte memory configurations not only a reality, but
commonplace.
Not all RAM performs equally. Newer types, called double data rate RAM
(DDR) decrease the time in takes for the CPU to communicate with memory,
thus speeding up computer execution. DDR comes in several flavors. DDR has
been around since 2000 and is sometimes called DDR1. DDR2 was introduced
in 2003. It took a while for DDR2 to reach widespread use, but you can find it in
most new computers today. DDR3 began appearing in mid-2007. RAM simply
holds data for the processor. However, there is a cache between the processor
and the RAM: the L2 cache. The processor sends data to this cache. When the
cache overflows, data are sent to the RAM. The RAM sends data back to the L2
cache when the processor needs it. DDR RAM transfers data twice per clock
cycle. The clock rate, measured in cycles per second, or hertz, is the rate at which
operations are performed. DDR clock speeds range between 200 MHz (DDR-
200) and 400 MHz (DDR-400). DDR-200 transfers 1,600 megabits per second
(Mb s) while DDR-400 transfers 3,200 MB s

DDR2 RAM is
twice as fast as DDR RAM. The bus carrying data to DDR2 memory is twice as
fast. That means twice as much data are carried to the module for each clock
cycle. DDR2 RAM also consumes less power than DDR RAM. DDR2 speeds
range between 400 MHz (DDR2-400) and 800 MHz (DDR2-800). DDR2-400
transfers 3,200 MB s

1
. DDR2-800 transfers 6,400 MB s

1
.DDR3RAM
is twice as fast as DDR2 RAM, at least in theory. DDR3 RAM is more power-
efficient than DDR2 RAM. DDR3 speeds range between 800 MHz (DDR3-800)
and 1,600 MHz (DDR3-1600). DDR3-800 transfers 6,400 MB s

1
;DDR3-1600
transfers 12,800 MB s

1
.
As processors increased in performance, the addressable memory space also
increased as the chips evolved from 8-bit to 64-bit. Bytes of data readily
8
B.A. Megrey and E. Moksness
accessible to the processor are identified by a memory address, which by
convention starts at zero and ranges to the upper limit addressable by the pro-
cessor. A 32-bit processor typically uses memory addresses that are 32 bits wide.
The 32-bit wide address allows the processor to address 2
32
bytes (B) of memory,
which is exactly 4,294,967,296 B, or 4 GB. Desktop machines with a gigabyte of
memory are common, and boxes configured with 4 GB of physical memory are
easily available. While 4 GB may seem like a lot of memory, many scientific
databases have indices that are larger. A 64-bit wide address theoretically allows
18 million terabytes of addressable memory (1.8 10
19
B). Realistically 64-bit
systems will typically access approximately 64 GB of memory in the next 5 years.
1.2.2 Hard Disks and Other Storage Media
Improvements in hard disk storage, since our last edition, have advanced as well.
One of the most amazing things about hard disks is that they both change and
don’t change more than most other components. The basic design of today’s
hard disks is not very different from the original 5¼’’ 10 MB hard disk that was
installed in the first IBM PC/XTs in the early 1980s. However, in terms of
capacity, storage, reliability and other characteristics, hard drives have substan-
tially improved, perhaps more than any other PC component behind the CPU.
Seagate, a major hard drive manufacturer, estimates that drive capacity increases
by roughly 60% per year (Source: http://news.zdnet.co.uk/communications/
0,100,0000085,2067661,00.htm, accessed 12 January 2008).
Some of the trends in various important hard disk characteristics (Source:
http://www.PCGuide.com, accessed 12 January 2008) are described below. The
areal density of data on hard disk platters continues to increase at an amazing
rate even exceeding some of the optimistic predictions of a few years ago.
Densities are now approaching 100 Gbits in

2
, and modern disks are now packing
as much as 75 GB of data onto a single 3.5 in platter (Source: http://www.
fujitsu.com/downloads/MAG/vol42-1/paper08.pdf, accessed 12 January 2008).
Hard disk capacity continues to not only increase, but increase at an accelerat-
ing rate. The rate of technology development, measured in data areal density
growth is about twice that of Moore’s law for semiconductor transistor
density (Source: http://www.tomcoughlin.com/Techpapers/head&medium.pdf,
accessed 12 January 2008).
The trend towards larger and larger capacity drives will continue for both
desktops and laptops. We have progressed from 10 MB in 1981 to well over
10 GB in 2000. Multiple terabyte (1,000 GB) drives are already available. Today
the standard for most off the shelf laptops is around 120–160 GB. There is also a
move to faster and faster spindle speeds. Since increasing the spindle speed
improves both random-access and sequential performance, this is likely to
continue. Once the domain of high-end SCSI drives (Small Computer System
Interface), 7,200 RPM spindles are now standard on mainstream desktop and
1 Past, Present and Future Trends in the Use of Computers
9
notebook hard drives, and a 10,000 and 15,000 RPM models are beginning to
appear. The trend in size or form factor is downward: to smaller and smaller
drives. 5.25 in drives have now all but disappeared from the mainstream PC
market, with 3.5 in drives dominating the desktop and server segment. In the
mobile world, 2.5 in drives are the standard with smaller sizes becoming more
prevalent. IBM in 1999 announced its
Microdrive
which is a tiny 1 GB or device
only an inch in diameter and less than 0.25 in thick. It can hold the equivalent of
700 floppy disks in a package as small as 24.2 mm in diameter. Desktop and
server drives have transitioned to the 2.5 in form factor as well, where they are
used widely in network devices such as storage hubs and routers, blade servers,
small form factor network servers and RAID (Redundant Arrays of Inexpen-
sive Disks) subsystems. Small 2.5 in form factor (i.e. ‘‘portable’’) high perfor-
mance hard disks, with capacities around 250 GB, and using the USB 2.0
interface are becoming common and easily affordable. The primary reasons
for this ‘‘shrinking trend’’ include the enhanced rigidity of smaller platters.
Reduction in platter mass enables faster spin speeds and improved reliability
due to enhanced ease of manufacturing. Both positioning and transfer perfor-
mance factors are improving. The speed with which data can be pulled from the
disk is increasing more rapidly than positioning performance is improving,
suggesting that over the next few years addressing seek time and latency will
be the areas of greatest attention to hard disk engineers. The reliability of hard
disks is improving slowly as manufacturers refine their processes and add new
reliability-enhancing features, but this characteristic is not changing nearly as
rapidly as the others above. One reason is that the technology is constantly
changing, and the performance envelope is constantly being pushed; it’s much
harder to improve the reliability of a product when it is changing rapidly.
Once the province of high-end servers, the use of multiple disk arrays
(RAIDs) to improve performance and reliability is becoming increasingly
common, and multiple hard disks configured as an array are now frequently
seen in consumer desktop machines. Finally, the interface used to deliver data
from a hard disk has improved as well. Despite the introduction to the PC world
of new interfaces such as IEEE-1394 (FireWire) and USB (universal serial bus)
the mainstream interfaces in the PC world are the same as they were through the
1990s: IDE/ATA/SATA and SCSI. These interfaces are all going through
improvements. A new external SATA interface (eSATA) is capable of transfer
rates of 1.5–3.0 Gbits s

1
. USB transfers data at 480 Mbits s

1
and Firewire is
available in 400 and 800 Mbits s

1
. USB 3.0 has been announced and it will
offer speeds up to 4.8 Gbits s

1
. Firewire will also improve to increases in the
range of 3.2 Gbits s

1
. The interfaces will continue to create new and improved
standards with higher data transfer rates to match the increase in performance
of the hard disks themselves.
In summary, since 1996, faster spindle speeds, smaller form factors, multiple
double-sided platters coated with higher density magnetic coatings, and
improved recording and data interface technologies, have substantially
increased hard disk storage and performance. At the same time, the price per unit of storage has decreased.
%d bloggers like this: